python analysis

Uncategorized
Wishlist Share

About Course

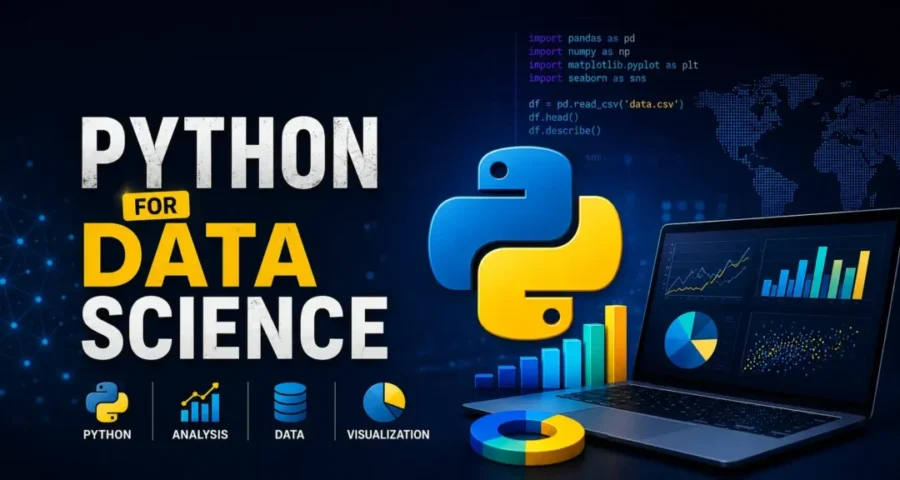
This course introduces students to the use of Python programming for data analysis, visualization, and decision-making. Students will learn the fundamentals of Python programming and apply them to collect, clean, transform, analyze, and visualize data using industry-standard libraries. The course emphasizes practical, hands-on experience with real-world datasets to develop analytical and problem-solving skills.

What Will You Learn?

  • By the end of this course, students will be able to:
  • Understand the fundamentals of Python programming, including variables, data types, operators, control structures, functions, and modules.
  • Read, write, and manipulate data from various file formats such as CSV, Excel, and JSON.
  • Use NumPy for numerical computing and efficient array operations.
  • Apply Pandas to clean, transform, merge, filter, and analyze datasets.
  • Perform exploratory data analysis (EDA) to identify patterns, trends, and relationships in data.
  • Create charts and visualizations using Matplotlib and Seaborn to communicate insights effectively.
  • Handle missing values, duplicate records, and inconsistent data to improve data quality.
  • Apply basic statistical techniques to summarize and interpret data.

Course Content

lesson 1: introduction
opics include Python syntax, data types, control structures, functions, file handling, data manipulation with NumPy and Pandas, data visualization using Matplotlib and Seaborn, and introductory statistical analysis. Students will also

Student Ratings & Reviews

No Review Yet
No Review Yet